Documentation
Everything you need to install, use, and configure Trace.
v1.0 — Updated April 2026
01 Getting Started
Install
Three methods. Pick the one that fits your setup.
brew install BlueMeta-Technologies/tap/tracescoop bucket add bluemeta https://github.com/BlueMeta-Technologies/scoop-bucket
scoop install tracecurl -sSL trace.bluemetatech.com/install.sh | shFirst run
Type trace and the product explains itself.
| Time | What happens |
|---|---|
| T+0s | You type trace |
| T+0.3s | First paint. Wordmark and loading indicator. |
| T+1s | Session index read. List populates with titles and dates. |
| T+5-15s | JSONL files parsed. Costs, tokens, and anomalies appear. |
| T+15s | Fully indexed. Scanner results flagged. Budget footer visible. |
No tutorial. No wizard. No signup. The product is immediately legible.
What Trace reads
Trace reads Claude Code session logs from ~/.claude/projects/. Each session is a JSONL file containing prompts, responses, and token usage data.
Trace does not modify these files. It does not read any other files on your system. All parsed data is stored in ~/.bluemeta/trace.db.
02 Interface
Session list
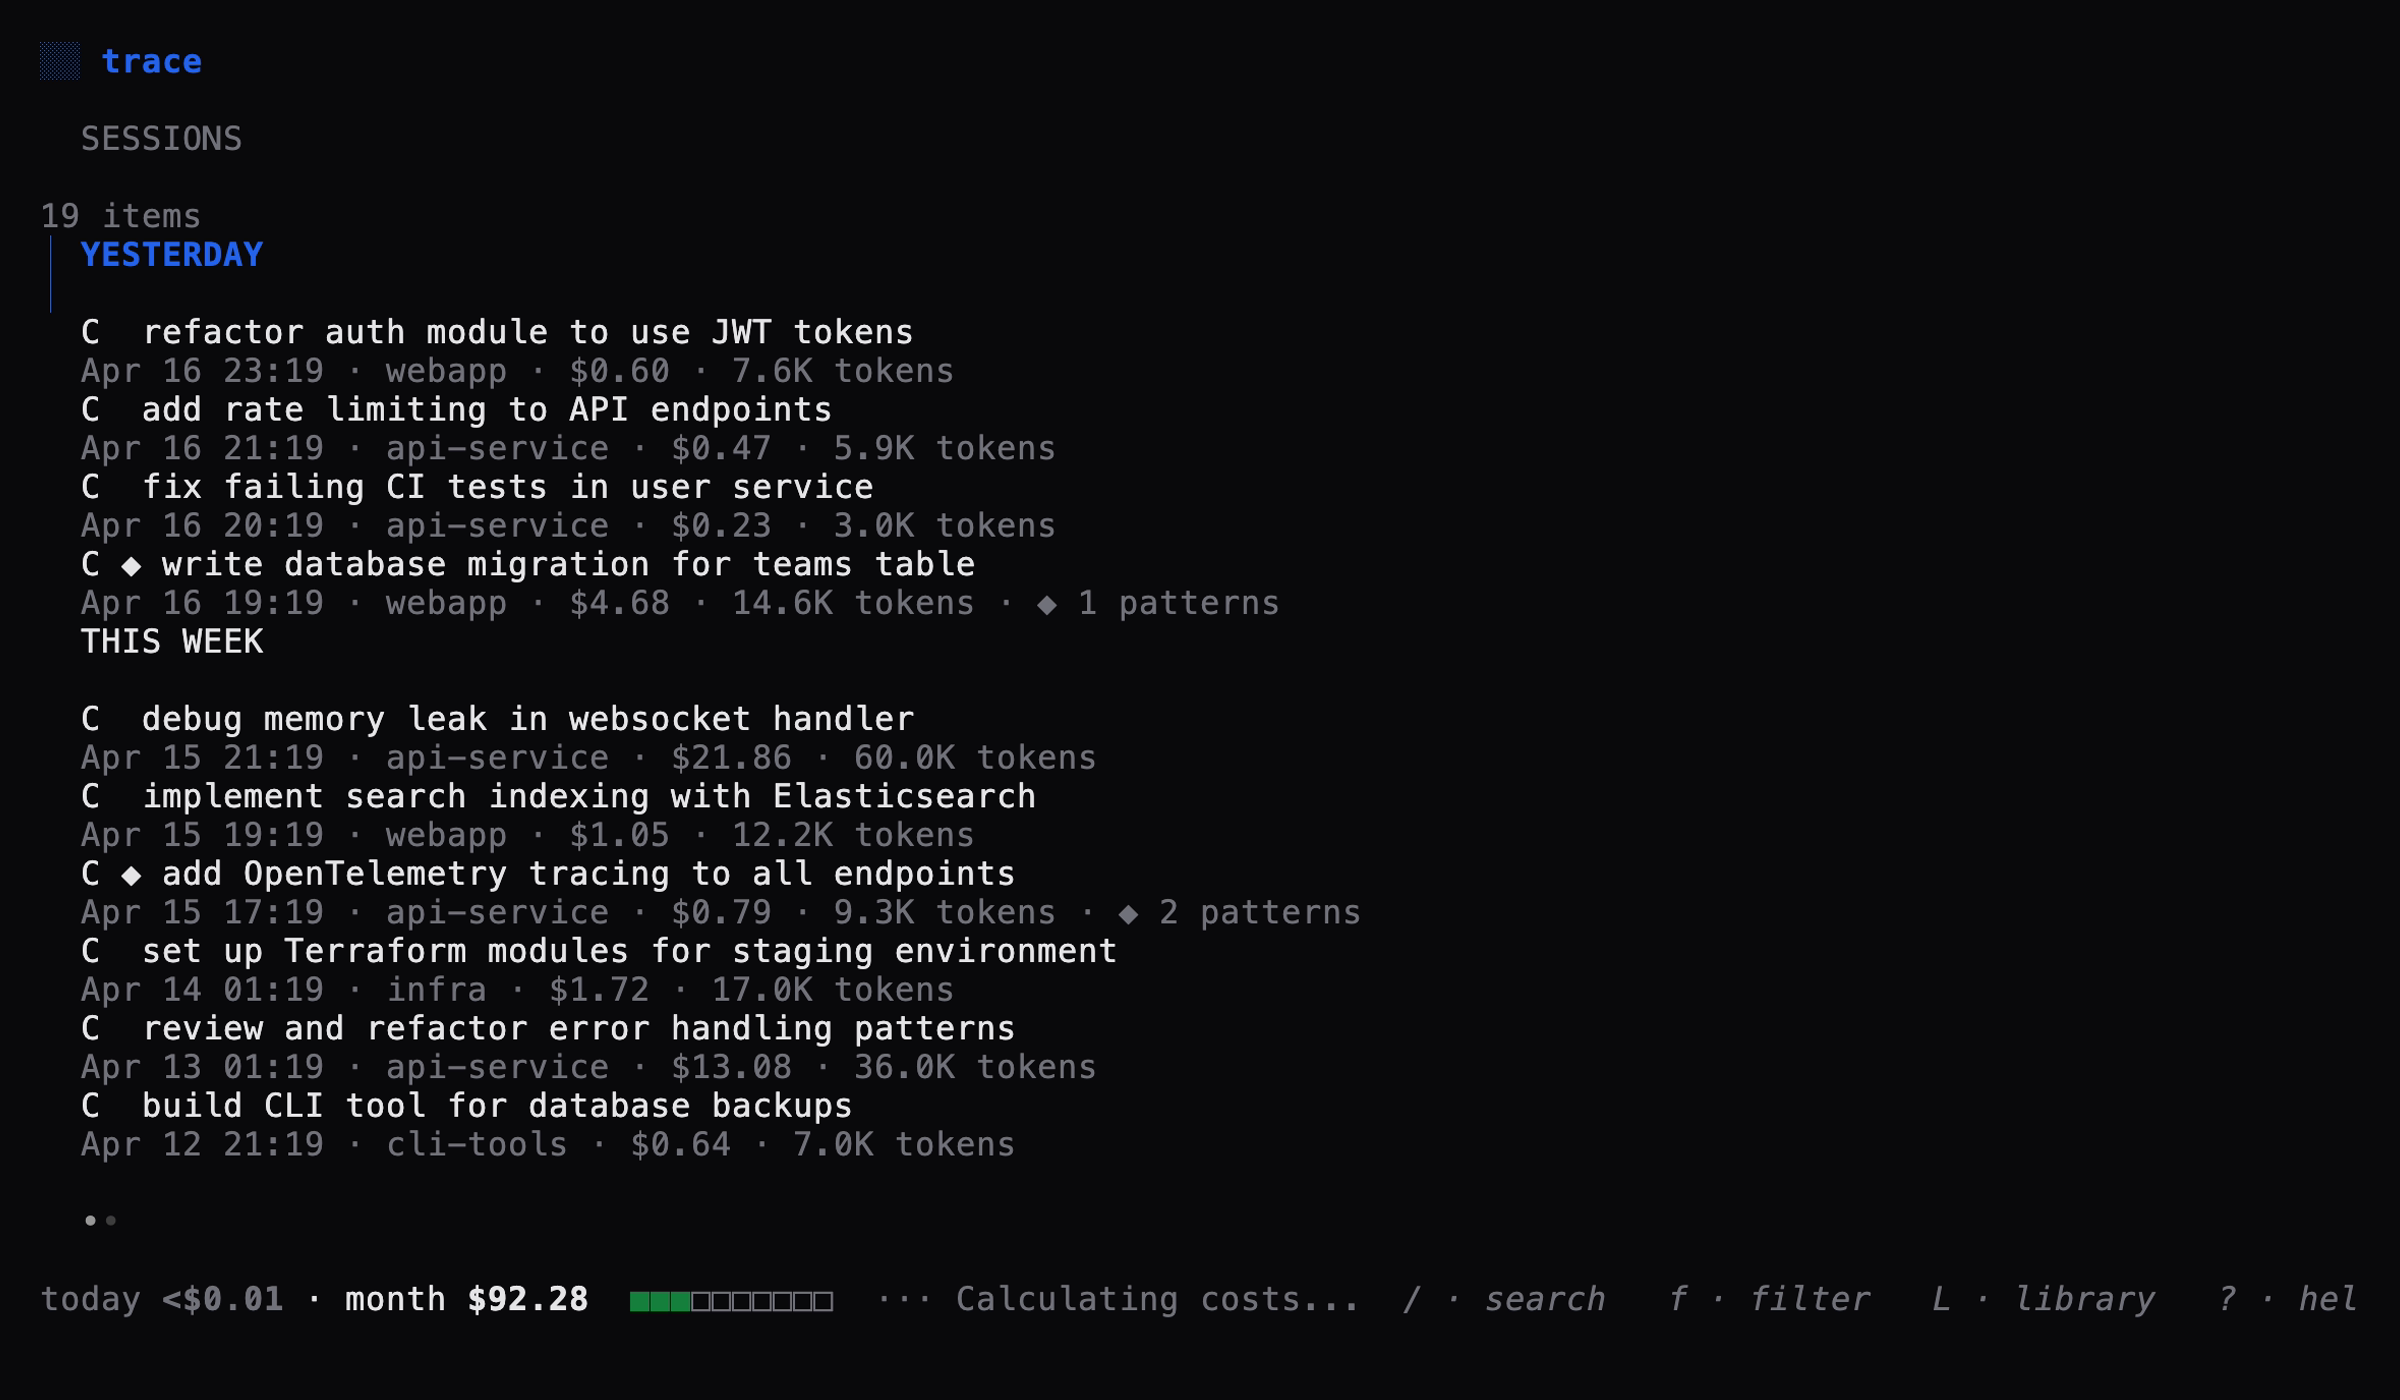
The home view. Every Claude Code session, newest first.
| Element | What it shows |
|---|---|
C | Claude Code session indicator |
U | Cursor session indicator (reserved for v1.1) |
| ◆ | Sensitive data patterns detected (local scan) |
| Title | Auto-generated from the first prompt, truncated to 60 characters |
| Metadata | Date, project name, cost, token count |
Sessions are grouped under TODAY, YESTERDAY, THIS WEEK, LAST WEEK, OLDER headers.
Session detail
Press Enter on any session. Three tabs, switchable via Tab or 1 2 3.
| Tab | Content |
|---|---|
| Prompts | Every message with role label (you / assistant), timestamp, and inline cost. Navigate with n/p. |
| Code | All fenced code blocks extracted from assistant responses, grouped by language. |
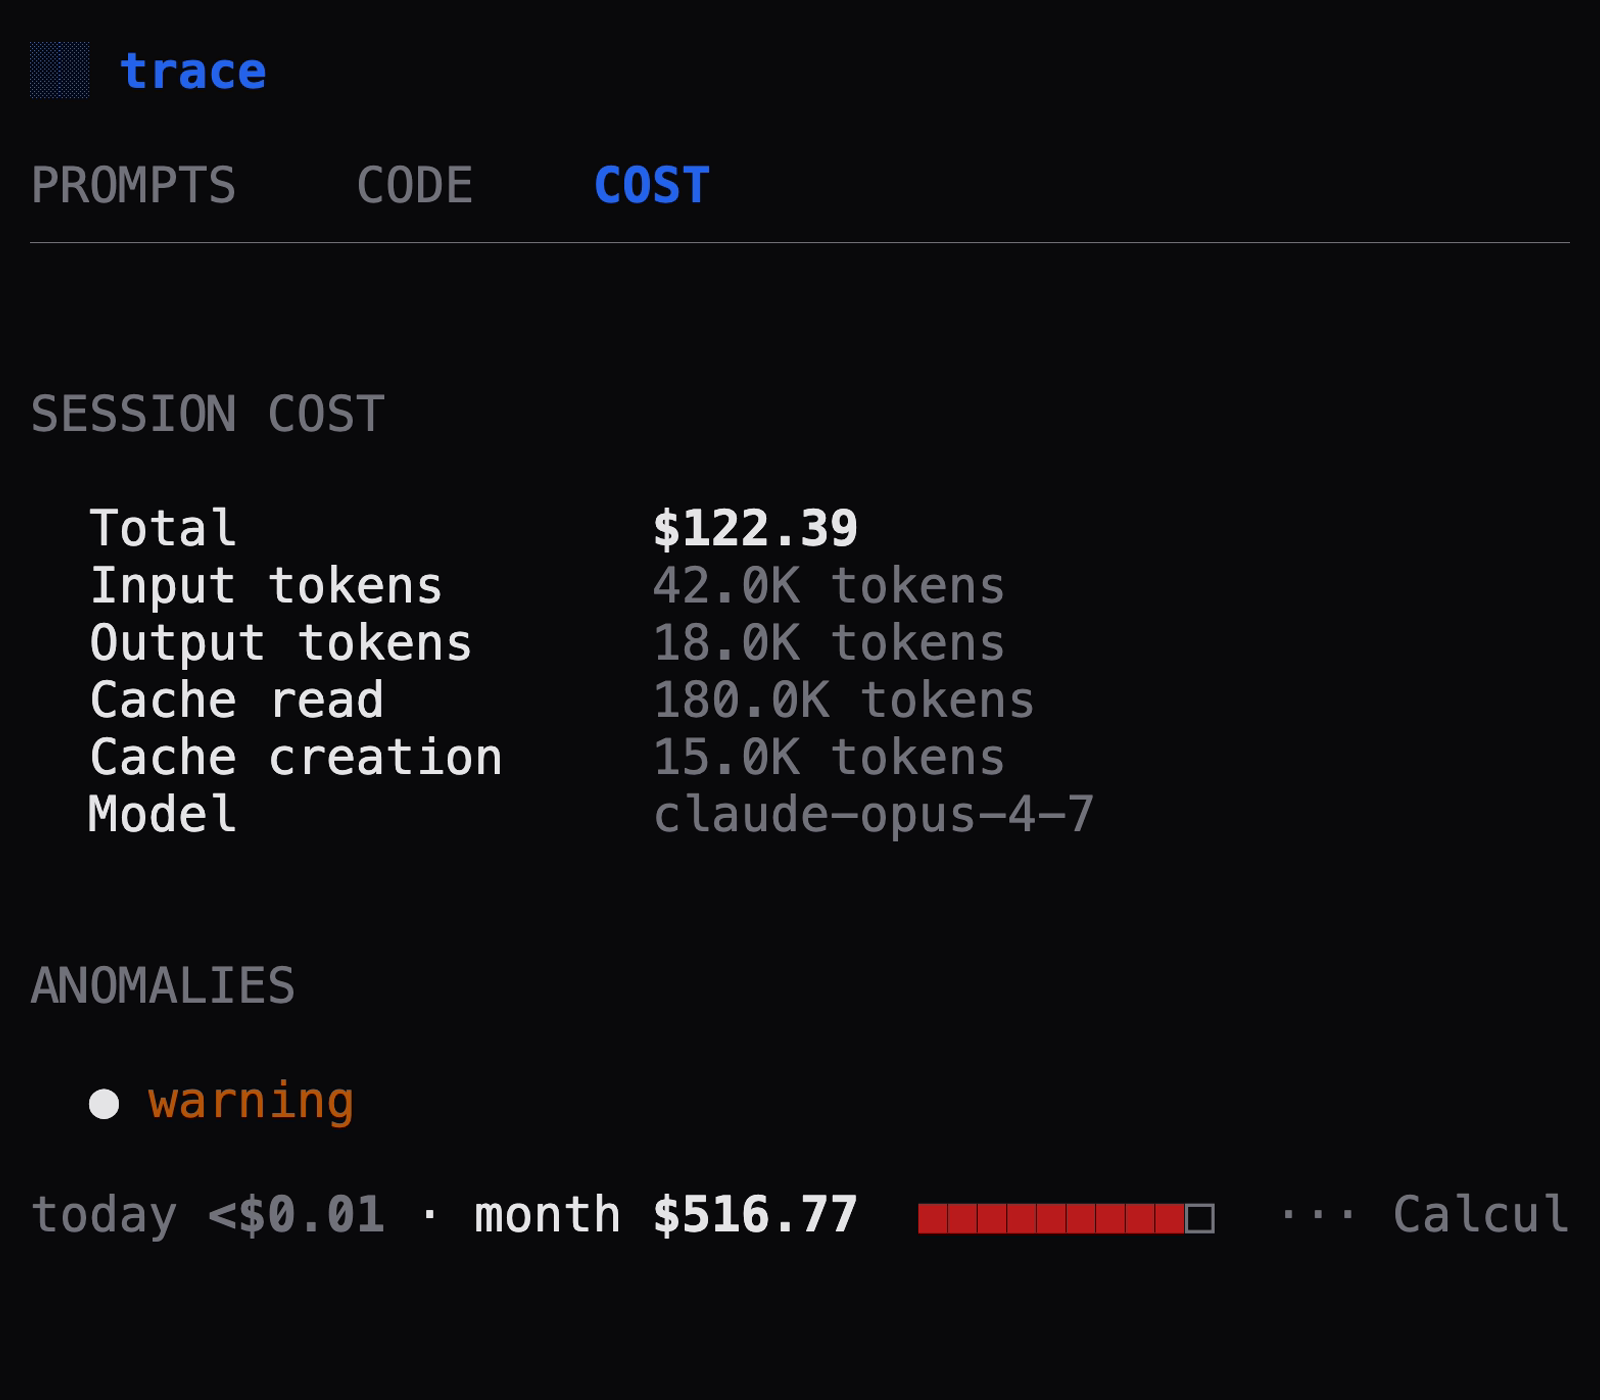
| Cost | Token breakdown (input, output, cache read, cache creation), model, anomaly explanations, sensitive data flags, per-message cost table. |
Press Esc to return to the session list.
Search
Press / to open full-text search. Searches across all session titles, prompts, and code using SQLite FTS5.
Type your query and press Enter. Results replace the session list. Press Esc to cancel and restore the full list.
Filters
Press f to open the filter panel.
| Filter | Options |
|---|---|
| Project | Auto-discovered from your sessions. Defaults to all. |
| Cost | all, >$1, >$10, >$50, >$100 |
| Anomalies | all or flagged only |
| Sensitive | all or flagged only |
Navigate with j/k, change values with h/l. Press Enter to apply, Esc to cancel.
Saved prompts library
Press L from the session list to browse your saved prompts.
| Action | Key |
|---|---|
| Save current prompt | s (in the Prompts tab) |
| Copy current prompt | c (in the Prompts tab) |
| Navigate prompts | n next, p previous |
| Open library | L (from session list) |
| Copy from library | c (in the library view) |
03 Intelligence
Cost tracking
Trace calculates cost per message by multiplying token counts against published Anthropic pricing.
| Token type | What it measures |
|---|---|
| Input | Tokens sent to the model (your prompts + context) |
| Output | Tokens generated by the model |
| Cache read | Tokens served from prompt cache (cheaper than input) |
| Cache creation | Tokens written to prompt cache (more expensive than input) |
Budget bar
The footer shows today's spend, monthly spend, and a color-coded budget bar when a budget is configured:
- Green — under 50% of budget
- Amber — 50-80% of budget
- Red — over 80% of budget
Set a budget in settings (,) or with --budget 500.
Anomaly detection
Trace computes a rolling 30-day baseline per tool and flags sessions that deviate significantly.
| Type | Trigger | Severity |
|---|---|---|
| Token spike | Total tokens > 3 standard deviations above baseline | Info / Warning / Critical (scales with magnitude) |
| Context bloat | Average input per message > 2x baseline | Warning |
| Output collapse | Output/input ratio < 0.5x baseline | Warning |
Anomaly explanations cite real numbers: "7.1x your typical session. Used 60.0K tokens total — baseline is 8.5K tokens."
Anomaly detection requires at least 10 sessions in the rolling baseline before flagging. The footer shows "Calibrating" until enough data is collected.
Sensitive data scanner
Local regex scanner runs during session ingestion. All scanning happens on your machine. No data is transmitted.
Credentials
| Pattern | Severity |
|---|---|
AWS access key (AKIA...) | Critical |
| AWS secret key | Critical |
GitHub token (ghp_, gho_, ghs_) | Critical |
| Generic API key/token | Warning |
Private key header (-----BEGIN PRIVATE KEY-----) | Critical |
Personal identifiers
| Pattern | Severity |
|---|---|
SSN format (XXX-XX-XXXX) | Critical |
| Credit card number (Luhn-validated) | Critical |
| Email address | Info |
Federal classification markers
| Pattern | Severity |
|---|---|
| TOP SECRET | Critical |
| SECRET (with marking format) | Critical |
| NOFORN | Critical |
| CUI | Warning |
| ITAR, EXPORT CONTROLLED | Warning |
| CONFIDENTIAL (with marking format) | Warning |
| UNCLASSIFIED//FOUO, FOR OFFICIAL USE ONLY | Info |
| LIMITED DISTRIBUTION | Info |
Contract markers
| Pattern | Severity |
|---|---|
| TRADE SECRET | Warning |
| ATTORNEY-CLIENT PRIVILEGED | Warning |
| PROPRIETARY | Info |
Disable the scanner entirely with --no-scan. Per-pattern configuration is planned for v1.1.
04 Configuration
Settings
Press , from the session list to open settings. Navigate with arrow keys, change values with h/l, press Esc to save and return.
| Setting | Options | Default |
|---|---|---|
| Theme | trace, mono, high-contrast | trace |
| Sensitive data scanner | on, off | on |
| Monthly budget | none, $50, $100, $200, $500 | none |
CLI flags
| Flag | Description | Default |
|---|---|---|
--theme | Color theme | trace |
--demo | Sanitize display for safe screenshots | off |
--no-scan | Disable sensitive data scanning | off |
--no-ingest | Skip session ingestion (use existing DB) | off |
--db <path> | Custom database file path | ~/.bluemeta/trace.db |
--budget <n> | Monthly budget in USD | 0 (no budget) |
--debug-watcher | Log all filesystem watcher events | off |
Examples
# Standard usage
trace

# High-contrast theme with $200 budget
trace --theme high-contrast --budget 200

# Demo mode for screenshots
trace --demo

# Use a pre-seeded demo database
trace --db ~/.bluemeta/trace-demo.db --no-ingest --no-scan
Demo mode
Run trace --demo to sanitize displayed data for safe screenshot sharing.
| What changes | How |
|---|---|
| Project names | Replaced with project-1, project-2, etc. |
| Username in paths | Replaced with user |
| Session titles | Truncated to first 8 words |
| Dollar amounts | Replaced with relative cost bars (■■■□□□□□) |
Demo mode is display-only. Stored data is never modified.
Privacy
All data stays local in ~/.bluemeta/trace.db. Trace makes three documented network calls:
| Call | When | Opt-in? |
|---|---|---|
| Update check | trace --check-updates | Yes |
| Pricing table fetch | trace update | Yes |
| Install verification | First install only | One-time |
Verify with network monitoring tools:
# macOS
nettop -p $(pgrep trace)

# Linux
ss -tunp | grep trace

# Windows
netstat -b | findstr trace
See the full Privacy Verification Guide.
Keyboard shortcuts
Global
| Key | Action |
|---|---|
| ? | Toggle help overlay |
| q / Ctrl+C | Quit |
| Esc / Backspace | Back (from any sub-view) |
Session list
| Key | Action |
|---|---|
| j / k | Navigate up / down |
| Enter | Open session detail |
| / | Full-text search |
| f | Open filters |
| L | Saved prompts library |
| , | Settings |
Session detail
| Key | Action |
|---|---|
| Tab / Shift+Tab | Next / previous tab |
| 1 2 3 | Jump to Prompts / Code / Cost tab |
| h / l | Previous / next tab |
| s | Save current prompt to library |
| c | Copy current prompt to clipboard |
| n / p | Next / previous user prompt |
| Esc | Back to session list |